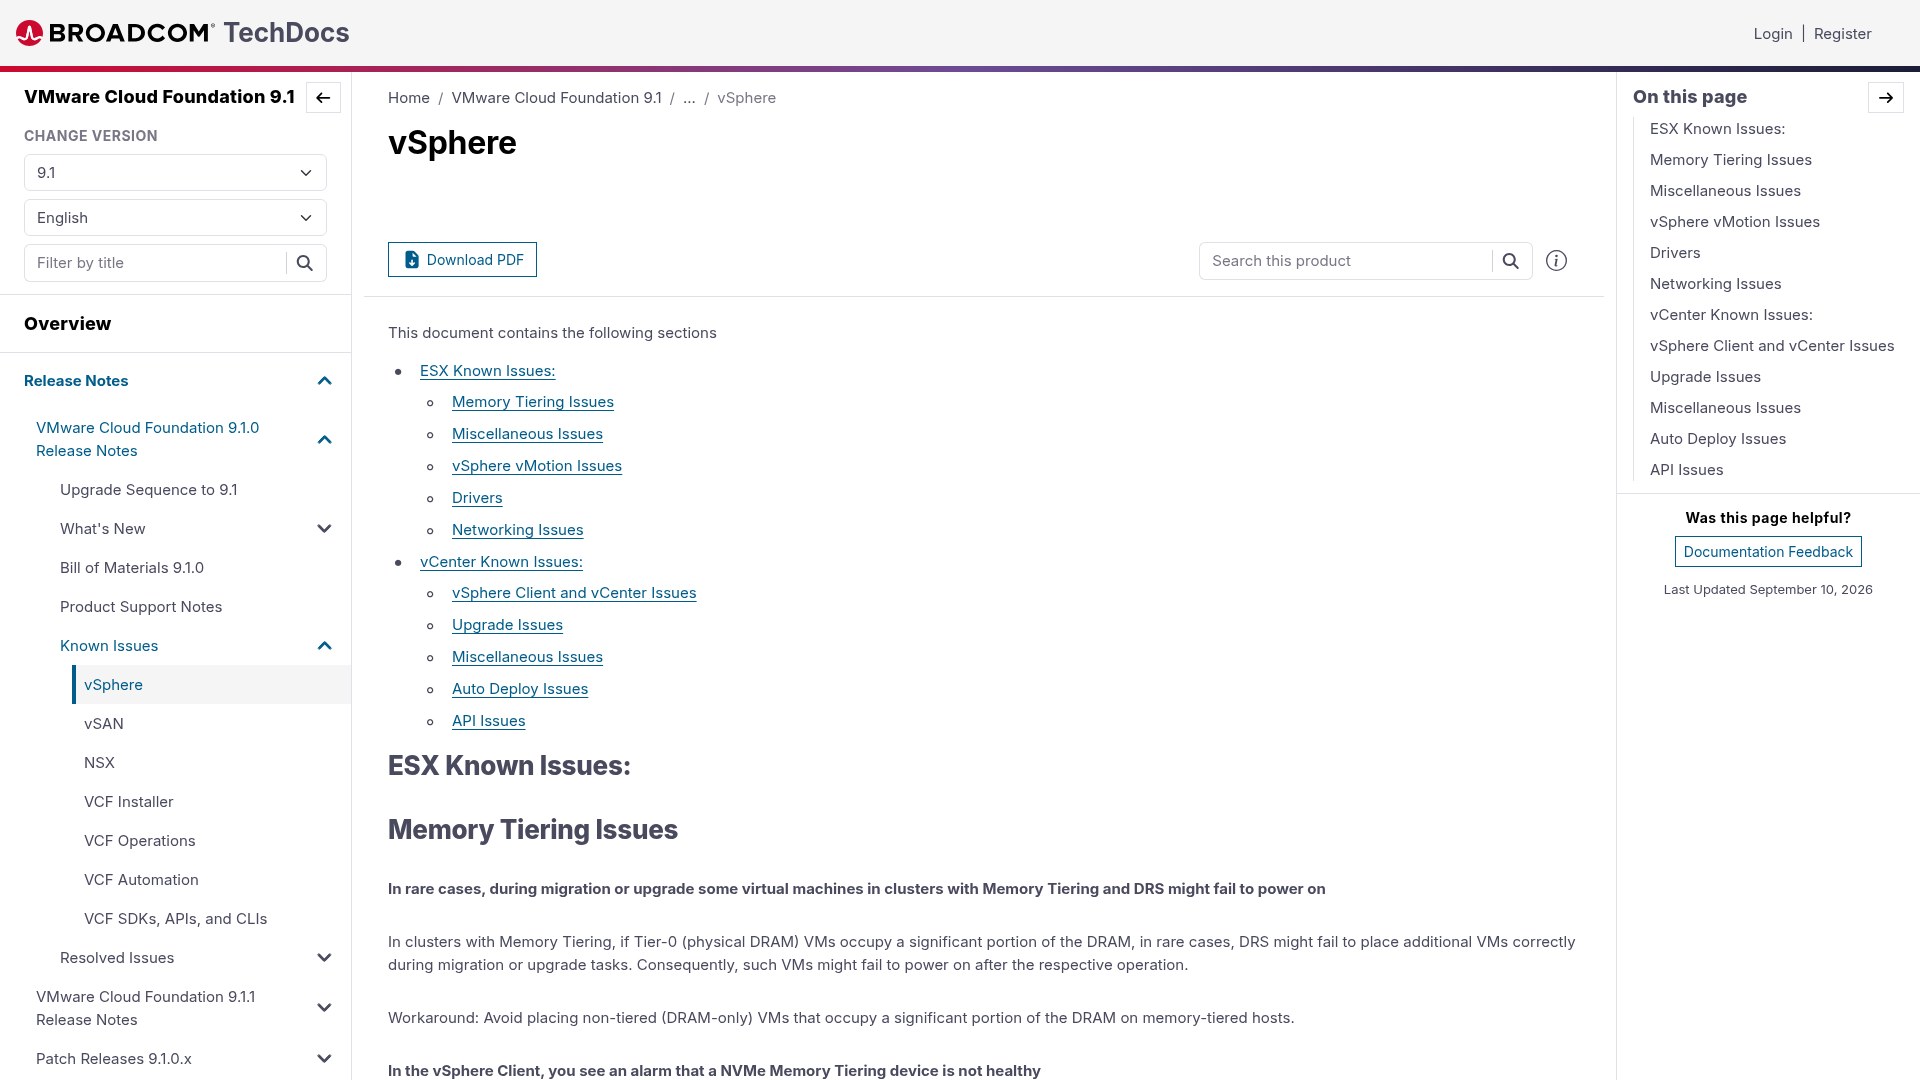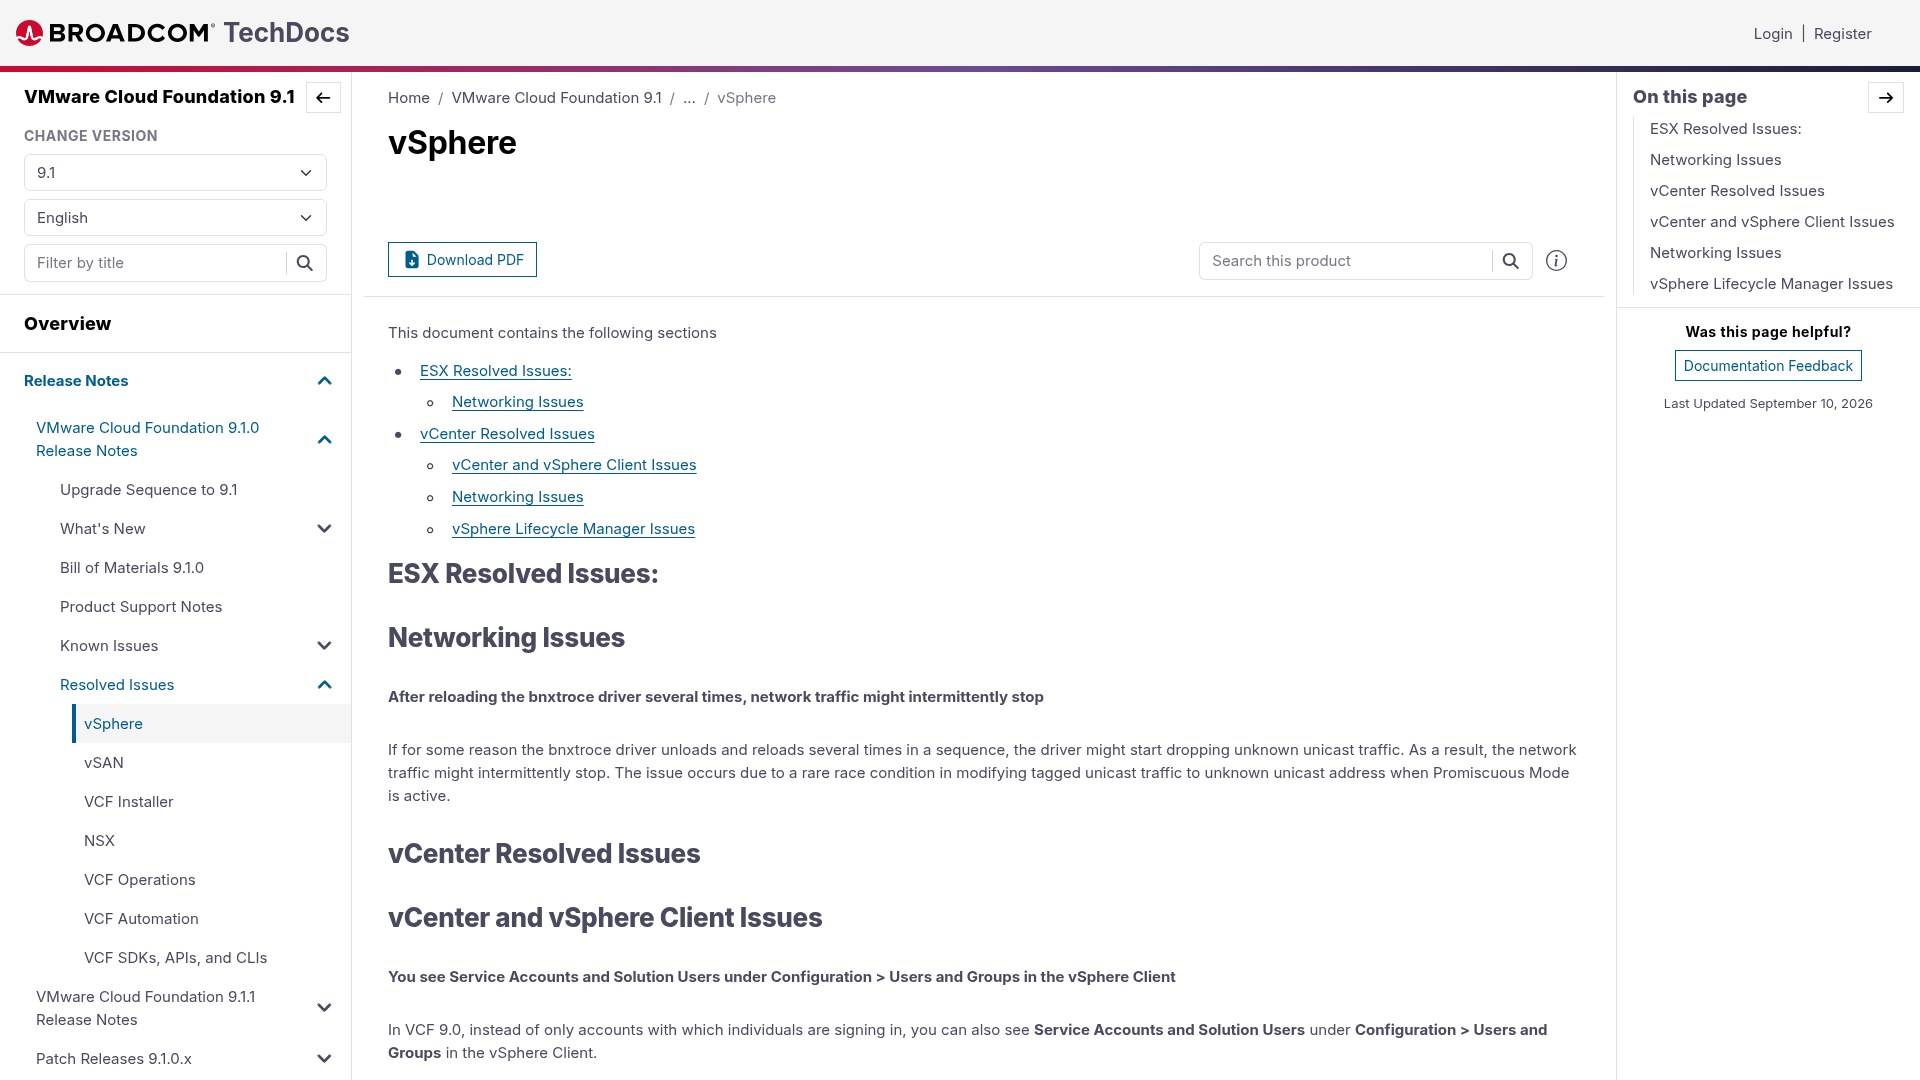

Every few months Broadcom drops a new ESXi patch and most of us skim the release notes for the CVE list, nod, and move on. That is a mistake. Buried in the Resolved Issues section of each build is a plain-English description of a bug that took somebody's production cluster down – the exact symptom, the race condition behind it, and the reason the fix works. Read properly, that section is the best free training material VMware publishes.
This article walks through five real, documented issues from the recent ESXi 8.0 Update 3e release notes (build 24674464, released 10 April 2025) and the ESX 9.0 known-issues list. For each one I explain the error you would actually see, the root cause as engineering described it, and what you should do about it. I have also added what these failures looked like from my side of the console, because release notes never tell you how the ticket actually felt at 2am.
A short confession before we start
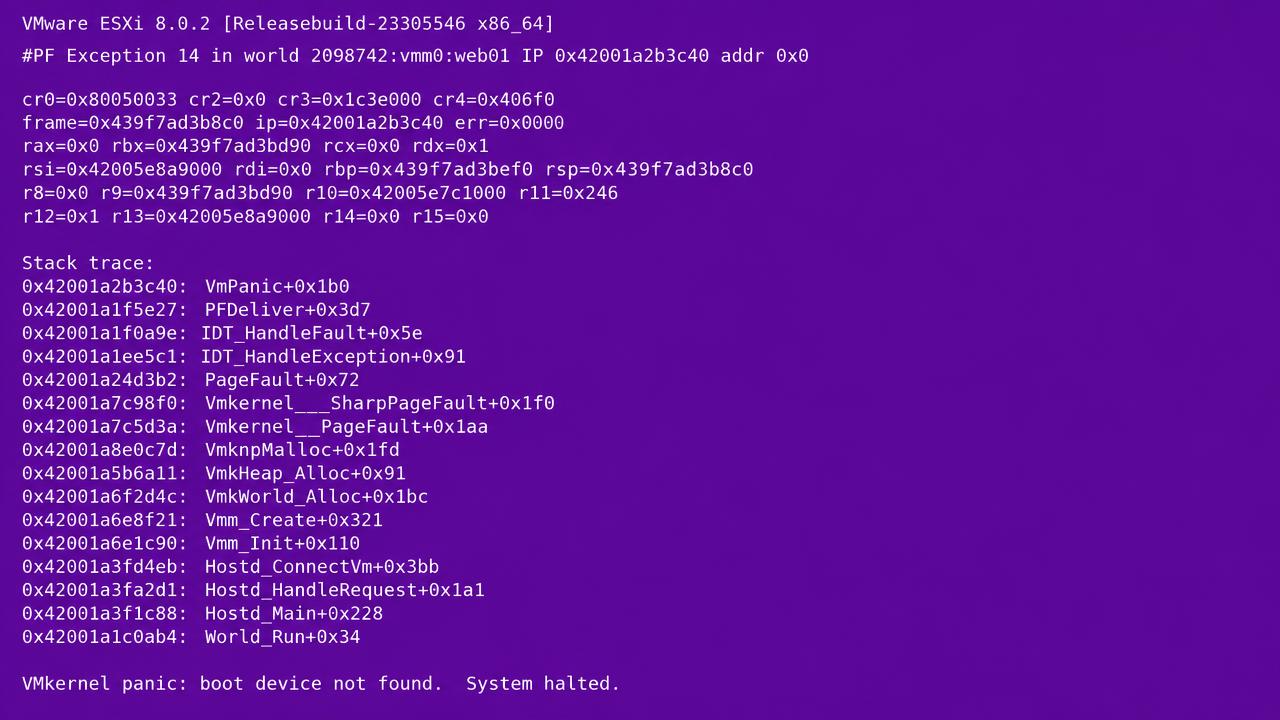
A few years back I inherited a four-node cluster running on vSphere Virtual Volumes. The storage vendor was happy, the array dashboard was green, and I had a maintenance window to Storage vMotion about sixty VMs onto a newer container. Twenty minutes in, host three dropped off vCenter. Not a network blip – gone. By the time I got the DCUI up on the iLO console I was looking at a purple diagnostic screen and a room full of people asking whether it was “the storage or the hypervisor”.
We failed everything over, restarted the migrations one at a time, and finished the window two hours late. My write-up at the time said “suspected transient storage fault”, which is engineer for “I have no idea”. Months later I read a release note that described what had happened to me almost word for word. That is the first bug on this list, and it is the reason I now read every set of release notes end to end.
Bug 1: Virtual machine migration on vVols causes a purple diagnostic screen (PR 3459100)
The symptom
The release note title is blunt: “Virtual machine migration in a vSphere Virtual Volumes datastore might cause an ESXi host to fail with a purple diagnostic screen.” The host does not degrade gracefully. It panics mid-migration, takes every running VM with it, and vSphere HA then restarts those VMs elsewhere – which is exactly why the blast radius feels bigger than one host.
The root cause
Broadcom describes it as: “During virtual machine migration from a vSphere Virtual Volumes datastore, a rare race condition in Device Block allocation tracking might lead to an ESXi host failure.”
Unpacking that: vVols does not present a shared VMFS volume. Each virtual disk is an individual object on the array, bound to the host through a protocol endpoint. The VMkernel keeps its own block allocation tracking for those devices. A migration tears down and rebuilds those bindings while I/O is still in flight. If two threads touch the allocation tracking structure in the wrong order – one freeing, one still referencing – you get a use-after-free in kernel context, and the VMkernel does the only safe thing available to it: it stops.
The word that matters in the note is race. A race is timing dependent, which is why this bug punishes people doing bulk migrations on busy arrays and never reproduces in a lab with three idle VMs.
The fix and what to do
Resolved in ESXi 8.0 Update 3e, build 24674464. The note says simply: “The fix prevents the race condition.” There is no workaround for a kernel race – you patch. If you cannot patch immediately, reduce concurrency: serialise Storage vMotion operations rather than queuing dozens, and avoid migrating off vVols during peak array load.
# Confirm your current build before you argue about whether you are affected
esxcli system version get

# Check which datastores are actually vVols
esxcli storage vvol storagecontainer list
esxcli storage vvol protocolendpoint list
Bug 2: Stuck I/O on local NVMe with ASSERT bora/modules/vmkernel/vmfs/fs3Misc.c:4245
The symptom
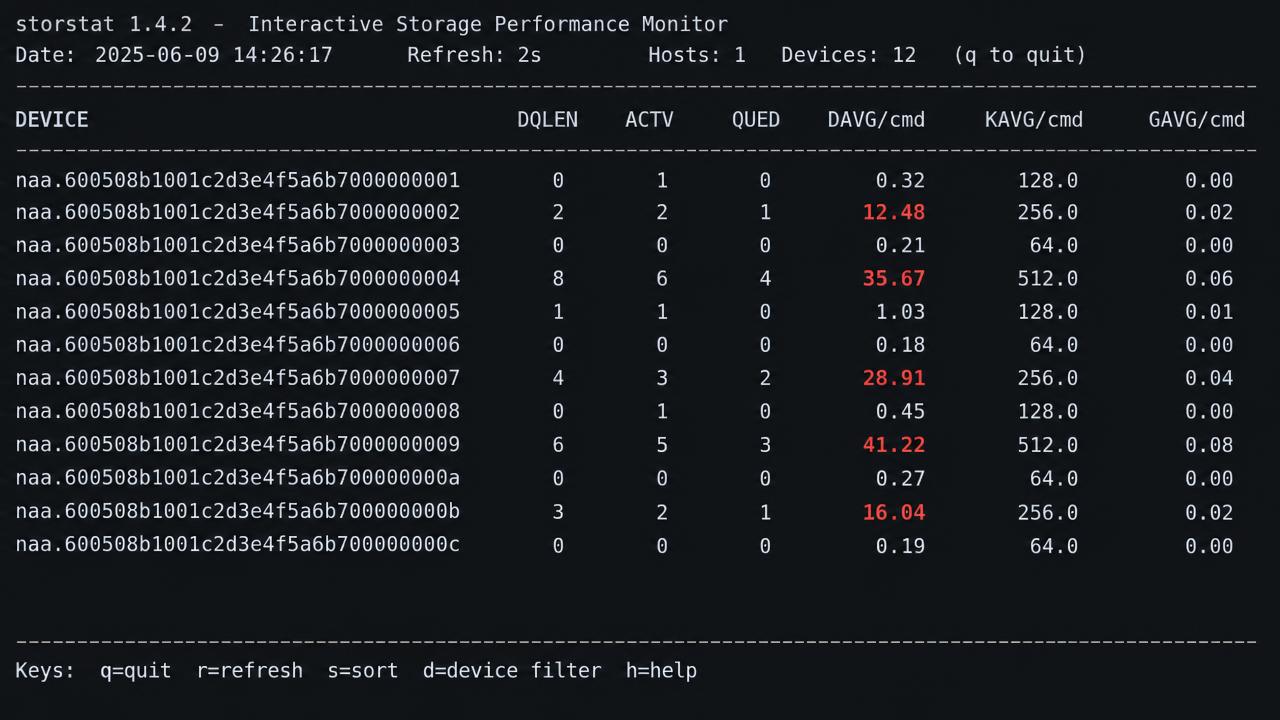
This is the one with a searchable error string, and if you have hit it you will recognise it instantly. The release note states you might see “an error such as BlueScreen: ASSERT bora/modules/vmkernel/vmfs/fs3Misc.c:4245”. Before the assert fires, the real-world symptom is I/O that never completes: VMs hang, a datastore browse spins forever, and esxtop shows commands outstanding with device latency climbing into the thousands of milliseconds while the disk itself is idle.
The root cause
This bug is a lovely example of a regression created by a sensible architectural change. From the note: “Starting in ESXi 8.0 Update 3, the handling of I/O for PRP ... was transferred from the driver to the Pluggable Storage Architecture (PSA).” PRP – Physical Region Page – is how NVMe describes the memory buffers backing a command. Large I/O gets split into multiple child commands to satisfy PRP alignment rules.
The defect: “A bug in PSA PRP handling, when a command is split into multiple child commands to handle the PRP requirements, might cause indefinitely stuck I/O. The issue occurs because if a child PRP memory allocation command fails, the parent command cannot complete.”
In other words, the parent command is waiting on a child that never comes back, because the child died during memory allocation and nothing put the frame back on the path queue. The parent sits there forever. Eventually a VMFS consistency assertion notices the impossible state and the host panics.
Scope
The note limits this to local PCIe NVMe disks, and only from ESXi 8.0 Update 3 onwards. If your boot and cache devices are local NVMe – which describes most modern vSAN ReadyNodes – you are in the affected population. SAN-attached storage is not.
The fix
Resolved in 8.0 U3e: “The fix adds the frame back in the path queue to make sure all child commands are processed and fixes the PRP child count when I/O fails due to issues such as path loss or no connectivity.” Note the second half – the trigger is usually an underlying transient failure. The bug turns a recoverable path error into an unrecoverable hang.
# Identify local NVMe devices and their paths
esxcli nvme device list
esxcli storage core device list | grep -i nvme

# Watch for stuck commands and aborts
esxcli storage core device stats get
tail -f /var/log/vmkernel.log | grep -iE 'nvme|abort|PRP'
Bug 3: Rebind versus lazy unbind race on vVols (PR 3450374)
The symptom
Another purple screen, another vVols race, but a different code path: “A rare race between rebind and lazy unbind tasks in vSphere Virtual Volume might cause an ESXi host to fail with a purple diagnostic screen.”
The root cause
To understand this one you need to know what rebind and unbind mean in vVols. When a VM powers on, the host asks the vendor provider to bind its virtual volumes to a protocol endpoint. The array can later ask the host to rebind – move that volume to a different protocol endpoint, typically for load balancing or during an array-side controller event. Separately, when a volume is no longer needed, the host performs a lazy unbind: it defers the teardown rather than doing it synchronously, to keep the I/O path fast.
Broadcom's description: “In rare cases, a lazy unbind of a vSphere Virtual Volume might start while a rebind operation is ongoing, or the other way around. As a result, the ESXi host fails with a purple diagnostic screen.” Two asynchronous operations mutating the same binding state, no mutual exclusion, and a kernel that cannot tolerate a half-torn-down binding.
What triggers it in the field
Array controller failovers, non-disruptive array firmware upgrades, and mass power-off events. Anything that makes the array issue rebind requests at the same moment your hosts are releasing volumes. This is why the bug tends to show up during storage maintenance windows rather than vSphere ones – and why the storage team and the virtualisation team spend the first hour blaming each other.
The fix
Resolved in 8.0 U3e. Patch. If you run vVols and you are planning array firmware work, get to U3e or later first – bugs 1, 3 and 4 on this list are all vVols and all fixed in the same build.
Bug 4: osfsd memory leak blocks vVols provisioning (PR 3476179)
The symptom
No crash this time – something more insidious. “A memory leak might prevent the Object Storage File System Daemon (osfsd) from processing requests for vSphere Virtual Volumes.” VM creation and cloning on vVols datastores simply stop working on an affected host. Existing VMs keep running, which is precisely what makes this hard to spot: monitoring is green, users are fine, and then a deployment pipeline starts failing with vague provisioning errors.
The root cause
From the note: “A rare memory leak condition in the osfsd service after prolonged uptime might prevent vSphere Virtual Volumes from provisioning virtual machines, including creation and cloning operations.”
osfsd is the user-world daemon that presents vVols objects as a filesystem namespace under /vmfs/volumes. Every provisioning request – create a config vVol, clone a data vVol, snapshot – goes through it. Leak enough memory and the daemon hits its resource pool limit and stops servicing requests.
The phrase “after prolonged uptime” is the tell. This is why the bug correlates with well-run environments: hosts that have not rebooted in 300 days are the ones that break. It also explains the folk remedy that circulated before the fix existed – put the host in maintenance mode and reboot it, and provisioning works again for another few months.
Diagnosing it
# Check uptime first - the correlation is real
uptime

# Look at user-world memory consumption
memstats -r uw-stats -s name:min:max:memSize:memSizePeak | grep -i osfs

# osfsd logs its own failures
grep -i osfsd /var/log/vvold.log
grep -i 'out of memory\|resource' /var/log/osfsd.log
The pre-fix workaround is a host reboot or an osfsd restart, which clears the leaked memory. The real answer is U3e.
Bug 5: vSAN stretched cluster reports checksum errors after a network outage (PR 3479340)
The symptom
This is the one most likely to cause a panic that is not warranted. The note reads: “After a network outage or some other critical event on a stretched cluster, the vSAN Distributed Object Manager (DOM) might fail to get the correct checksums for objects that do not have sub-fault tolerance. As a result, you might see in tools such as VMware Skyline Health Diagnostics checksum errors for many objects in the stretched cluster.”
Read that carefully. DOM fails to get the correct checksums – the reporting is wrong. Hundreds of objects suddenly show checksum errors after an inter-site link failure, and the on-call engineer's first thought is silent data corruption across the estate. I have watched a team start planning a full restore from backup on the strength of a dashboard that was itself the bug.
The root cause
In a stretched cluster, object components live across two fault domains plus a witness. After a site partition heals, DOM re-evaluates component state. For objects without sub-fault tolerance – that is, without a nested local protection layer within a site – the checksum retrieval path returns incorrect results, and health tooling faithfully reports what it is told.
What to do before you panic
- Check whether the errors appeared immediately after a partition or link event. Correlation with an outage is the strongest signal that you are looking at this bug.
- Verify object health directly rather than trusting the aggregate dashboard.
- Confirm whether the affected objects actually use sub-fault tolerance – the bug only touches those that do not.
- Check guest-level integrity on a sample of the “corrupted” VMs. Real corruption shows up inside the guest; this bug does not.
# Cluster and object level health from a host
esxcli vsan health cluster list
esxcli vsan debug object health summary get
esxcli vsan debug object list --all | head -50

# Resync state after a partition heals
esxcli vsan resync bandwidth get
esxcli vsan cluster get
Resolved in 8.0 U3e. Until you patch, treat a wave of post-outage checksum alerts on a stretched cluster as suspect until you have corroborating evidence from inside a guest.
Bonus: two open issues in ESX 9.0 worth knowing
These are not fixed – they are current known issues in the ESX 9.0 documentation, which means you will meet them rather than read about them afterwards.
VMs with more than 60 vCPUs fail to power on with memory tiering
With memory tiering enabled, “virtual machines configured with more than 60 vCPUs fail to power-on ... due to an issue with the overhead memory allocation.” Every VM carries an overhead memory reservation on top of its configured RAM, scaled by vCPU count. Memory tiering changes how that overhead is calculated and the growth limit is too tight for very wide VMs.
The documented workaround is an advanced setting:
esxcli system settings advanced set -o /Mem/VMOverheadGrowthLimit -i 3
esxcli system settings advanced list -o /Mem/VMOverheadGrowthLimit
Set Mem.VMOverheadGrowthLimit to 3. If your monster VMs power on fine on some hosts and not others, check this setting before you check anything else.
vSphere Lifecycle Manager remediation fails against a DPU
The error surfaced in the client is Failed to start vAPI task on data processing unit, and in lifecycle.log you will find:
Invalid field software_spec in structure com.vmware.esx.settings_daemon.software.scan_specThe cause is components removed from the vLCM image that the DPU still expects to be present, so the scan specification sent to it is incomplete. The documented workaround: “Edit the vSphere Lifecycle Manager image from the vSphere Client or from the JSON file to restore all removed components, and retry.”
The pattern across all five bugs
| Issue | Class | Trigger | Visible symptom |
|---|---|---|---|
| vVols migration panic (PR 3459100) | Kernel race | Bulk Storage vMotion | Purple diagnostic screen |
| PSA PRP stuck I/O | Regression in 8.0 U3 | Local NVMe path error | ASSERT ... fs3Misc.c:4245, hung I/O |
| Rebind vs lazy unbind (PR 3450374) | Kernel race | Array controller event | Purple diagnostic screen |
| osfsd leak (PR 3476179) | Resource leak | Long host uptime | vVols provisioning fails |
| vSAN checksum reporting (PR 3479340) | False reporting | Stretched cluster partition | Mass checksum alerts |
Three of the five only appear under concurrency or after a long soak. That is the honest reason these bugs reach production: nobody's test plan includes “run for 300 days and then fail an array controller mid-migration”. Your production estate is the only environment that runs that test.
How I read release notes now
- Search the Resolved Issues section for the word “purple” first. Anything that panics a host outranks everything else.
- Grep for your own stack. vVols, vSAN, NVMe, the driver names for your NICs and HBAs. Ignore the rest – you cannot hold 200 PRs in your head.
- Look for “starting in version X”. That phrase marks a regression, and regressions are the bugs most likely to bite you right after an upgrade you thought was routine.
- Copy any verbatim error string into your knowledge base. When someone pastes
fs3Misc.c:4245into a chat at 2am, the person who recognises it saves the shift. - Read Known Issues before you plan an upgrade, not after. The 60-vCPU power-on failure above costs ten seconds to prevent and half a day to diagnose cold.
The practical takeaway
Four of the five resolved issues here landed in a single build: ESXi 8.0 Update 3e, build 24674464. If you run vVols, local NVMe, or a stretched vSAN cluster and you are still on an earlier 8.0 U3 build, that patch is not optional maintenance – it is three host-panic fixes and a provisioning fix in one bulletin.
And the wider point: the two hours I lost on that vVols migration were spent proving something that Broadcom had already documented in two paragraphs. The release notes are not marketing. They are the field notes of every engineer who hit the bug before you.
Related reading on this site: decoding an ESXi purple diagnostic screen, diagnosing APD, PDL and storage latency, and fixing snapshot consolidation failures.