Storage problems produce the widest range of symptoms in a vSphere estate: VMs freeze for thirty seconds and recover, datastores show as inactive, guests log SCSI timeouts, or a host disconnects entirely. Underneath, most of them reduce to three conditions the VMkernel handles very differently – All Paths Down (APD), Permanent Device Loss (PDL), and plain latency. Knowing which one you have determines everything you do next.
APD versus PDL – the distinction that matters
| APD | PDL | |
|---|---|---|
| Meaning | Host lost all paths but the array never said the device is gone | Array explicitly reported the device is permanently unavailable |
| Typical cause | Fabric outage, switch reboot, cabling, HBA failure, target port down | LUN unmapped, deleted, or masked away on the array |
| SCSI sense | No response – commands queue and time out | Sense code such as 0x5 0x25 0x0 LOGICAL UNIT NOT SUPPORTED |
| Host behaviour | Retries for 140 seconds by default, then fast-fails IO | Immediately fails IO, marks device dead |
| Recovery | Restore paths; device recovers automatically | Remove the dead device, then rescan |
Read that table before you touch anything, because the wrong assumption sends you rebooting hosts when the array simply needs a LUN re-presented.

Step 1: read the logs that name the condition
ESXi states both conditions explicitly. Search for the exact strings:
grep -i "APD" /var/log/vmkernel.log | tail -40
grep -i "PDL\|Permanent Device Loss" /var/log/vmkernel.log | tail -40
grep -i "H:0x\|D:0x\|Valid sense data" /var/log/vmkernel.log | tail -40
Typical entries look like Device naa.6005... has entered the All Paths Down state followed later by ...has exited the All Paths Down state, or for PDL, permanently inaccessible. The sense-data lines decode as host status (H), device status (D) and sense keys – H:0x0 D:0x2 with sense 0x5 0x25 0x0 is the canonical PDL signature.
Step 2: check paths and multipathing
esxcli storage core device list
esxcli storage core path list | grep -A4 "naa.6005"
esxcli storage nmp device list
esxcli storage core adapter list
esxcli storage san fc list        # FC fabric state, port WWNs, link status
Confirm each device has the expected number of active paths and the right path selection policy. For most active/active arrays that is VMW_PSP_RR (round robin); active/passive ALUA arrays should be using the vendor's supported SATP claim rules. A device sitting on one path when it should have four tells you where the fabric fault is.
Set round robin and a sensible IOPS limit where the vendor recommends it:
esxcli storage nmp device set --device naa.6005... --psp VMW_PSP_RR
esxcli storage nmp psp roundrobin deviceconfig set \
  --device naa.6005... --type iops --iops 1
Step 3: measure latency properly with esxtop
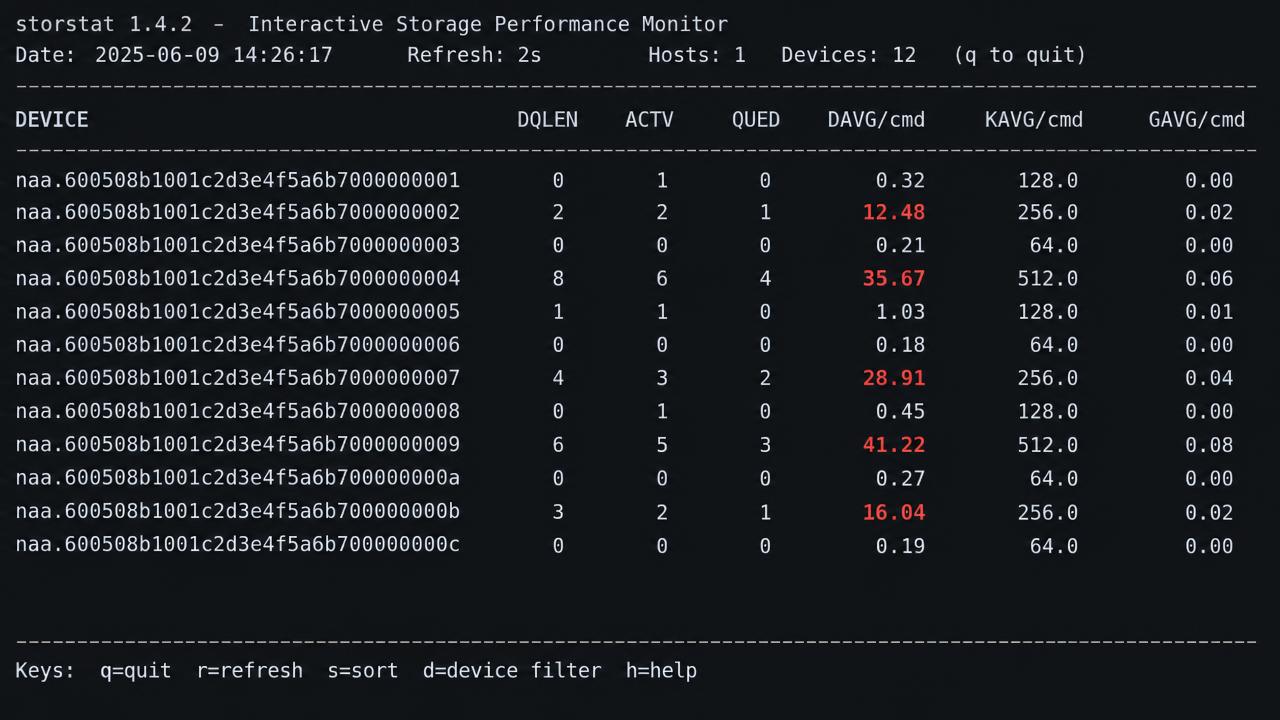
Run esxtop on the host, press u for the device view (or d for adapter, v for VM). The columns that matter:
- DAVG/cmd – device (array + fabric) latency in milliseconds. Sustained above 20-25ms means the storage or path is the bottleneck.
- KAVG/cmd – kernel latency. Should be under 1ms; anything above 2ms points at queuing on the host.
- GAVG/cmd – guest latency, effectively DAVG + KAVG. This is what the application feels.
- QUED – commands queued. Persistently non-zero means you are hitting a queue depth limit.
- ABRTS/s and RESETS/s – aborts and bus resets. Anything sustained here is a serious fault, not a tuning issue.
For a repeatable capture rather than a live look, run esxtop in batch mode and analyse the CSV:
esxtop -b -a -d 5 -n 720 > /vmfs/volumes/ds-local01/esxtop-$(hostname -s).csvThat is one hour at five-second resolution – enough to correlate an application complaint with an actual latency spike, which is the difference between a storage case and an argument.
Step 4: recover from APD
- Identify the scope: one host or all hosts? One device or all devices? A single host points at HBA, cabling or that host's zoning; all hosts points at the array or a fabric switch.
- Check the fabric: switch port status, SFP light levels, recent configuration changes, and the array's own event log.
- Restore the path. When paths return, ESXi exits APD automatically and datastores remount without a reboot.
- Rescan to confirm:
esxcli storage core adapter rescan --all. - If VMs are stunned and unresponsive after paths return, check for hung worlds before rebooting:
esxcli vm process listthenesxcli vm process kill --type=soft --world-id=<id>.
Two host advanced settings govern APD behaviour and should be reviewed rather than blindly changed: Misc.APDHandlingEnable (default 1) and Misc.APDTimeout (default 140 seconds). With APD handling on, HA can respond to storage failures via the Datastore with APD failure response – worth configuring deliberately on clusters where storage outages have caused long stuns.
Step 5: recover from PDL
PDL means the array told you the LUN is gone. If that was intentional (a decommissioned LUN), clean up properly:
esxcli storage core device detached list
esxcli storage core device detached remove -d naa.6005...
esxcli storage core adapter rescan --all
If it was not intentional, treat it as an array-side incident: check LUN masking and mapping, host group membership after a controller failover, and whether a firmware upgrade re-presented devices with different identifiers. Configure the HA Datastore with PDL response to power off and restart affected VMs so a mis-presented LUN does not leave zombie VMs running on dead storage.
Step 6: address chronic latency, not just incidents
When there is no APD or PDL and DAVG is simply high, work through the usual suspects in order:
- Queue depth – check the HBA's device queue depth (
esxcli storage core device list, Device Max Queue Depth) and whether Storage IO Control is throttling. - Oversubscription – too many busy VMs on one datastore, or too many datastores behind one array port.
- Array-side contention – a rebuild, a snapshot schedule, or a noisy neighbour on a shared array.
- Path policy – a device stuck on fixed path policy sending all IO down one link.
- Firmware and drivers – HBA firmware/driver pairs outside the compatibility matrix cause intermittent aborts that look like array problems.
- VMFS heap and thin provisioning – watch for
THIN_PROVISION_SOFT_THRESHOLDwarnings; an array running out of pool space is a latency cliff waiting to happen.
Monitoring that catches it early
- Alert on datastore latency above 20ms sustained for five minutes, per datastore.
- Alert on any APD or PDL string appearing in forwarded syslog.
- Alert on path count changes – a silent drop from four to two paths is your early warning of the outage next month.
- Track array pool utilisation alongside datastore utilisation; thin-on-thin hides the real number.
- Keep an up-to-date diagram of host-to-fabric-to-array paths; during an incident it saves more time than any command.
Classify first, then act: APD means find the broken path, PDL means find out why the array withdrew the LUN, and neither is solved by rebooting hosts and hoping.
Decoding SCSI sense data
The vmkernel logs SCSI errors in a fixed format that looks impenetrable but is easy to read once split into fields:
ScsiDeviceIO: Cmd(0x45a...) 0x28, CmdSN 0x1 from world 2098 to dev "naa.6005..."
failed H:0x0 D:0x2 P:0x0 Valid sense data: 0x5 0x25 0x0- H: host status from the HBA driver.
0x0is OK;0x1NO_CONNECT,0x5TIMEOUT and0x8BUS_BUSY all point at fabric or adapter problems. - D: device status from the array.
0x2means CHECK CONDITION – the array is returning sense data that explains itself. - Sense key / ASC / ASCQ: the trio at the end.
0x5 0x25 0x0is ILLEGAL REQUEST / LOGICAL UNIT NOT SUPPORTED, the PDL signature.0x2 0x4 0x1is NOT READY / becoming ready, normal briefly after a controller failover.0x6 0x29 0x0is UNIT ATTENTION / power-on reset, expected after array maintenance.
Reading these three fields turns "storage is broken" into a precise statement you can take to the storage team or the array vendor.
Protocol-specific checks
iSCSI
esxcli iscsi adapter list
esxcli iscsi adapter discovery sendtarget list
esxcli iscsi session list
esxcli network ip interface ipv4 get -i vmk1
vmkping -I vmk1 -s 8972 -d 10.20.30.40   # jumbo frame end-to-end test
Port binding, MTU consistency along the entire path, and flow control on the switch are the three iSCSI faults that appear most often. A jumbo-frame path that fails only under load usually means one switch in the chain is not configured for the same MTU.
NFS
esxcli storage nfs list
esxcli storage nfs41 list
grep -i "NFS" /var/log/vmkernel.log | tail -30
NFS datastores show "has entered the all paths down state" too, but the fix is on the network and the NAS export – check export permissions, the server's own load, and whether a failover between filer heads coincided with the event.
vSAN
On vSAN, ignore the LUN model entirely and work from object health: check Skyline Health, disk-group state, resync activity and network health. A resync after a failed capacity device produces exactly the latency profile that looks like an array problem on traditional storage.
Building a repeatable storage incident runbook
- Capture scope in the first five minutes: which hosts, which datastores, which VMs, and the exact start time.
- Grep vmkernel for APD, PDL and sense data on one affected host; classify the condition.
- Snapshot the path state with
esxcli storage core path listso you can compare after recovery. - Start an esxtop batch capture so you have latency data covering the incident rather than reconstructing it later.
- Engage the storage and network teams with the sense codes and path counts, not with the phrase "VMs are slow".
- After recovery, confirm path counts returned to their expected values and datastores are not left in a degraded multipathing state.
The teams that recover from storage incidents quickly are not the ones with the deepest command knowledge – they are the ones who classify the condition correctly in the first ten minutes and stop the estate from chasing the wrong layer.