A purple diagnostic screen – the VMware ESXi Purple Screen of Death, or PSOD – is the hypervisor telling you it detected a state so inconsistent that continuing would risk data corruption. It is a controlled halt, not a crash in the Windows sense, and almost every PSOD leaves behind enough evidence to identify the faulting component. This guide walks through reading the purple screen, retrieving and decoding the core dump, correlating the panic with hardware and driver inventory, and closing out the root cause so the same host does not panic again next month.
What a PSOD actually is
The VMkernel raises a panic when an unrecoverable condition is hit: an unhandled page fault in kernel space, a lock timeout (spin count exceeded), a machine check exception (MCE) reported by the CPU, a NMI from the baseboard management controller, or a corrupted heap. Rather than allowing the scheduler to keep running virtual machines on top of memory it can no longer trust, the kernel quiesces all CPUs, writes a core dump, and prints the panic banner.
That distinction matters for triage. A page fault in a third-party driver is a software defect you can fix with a VIB update. A machine check exception is the CPU or memory controller reporting a hardware fault, and no amount of patching will help until the DIMM or socket is replaced.
Reading the purple screen line by line
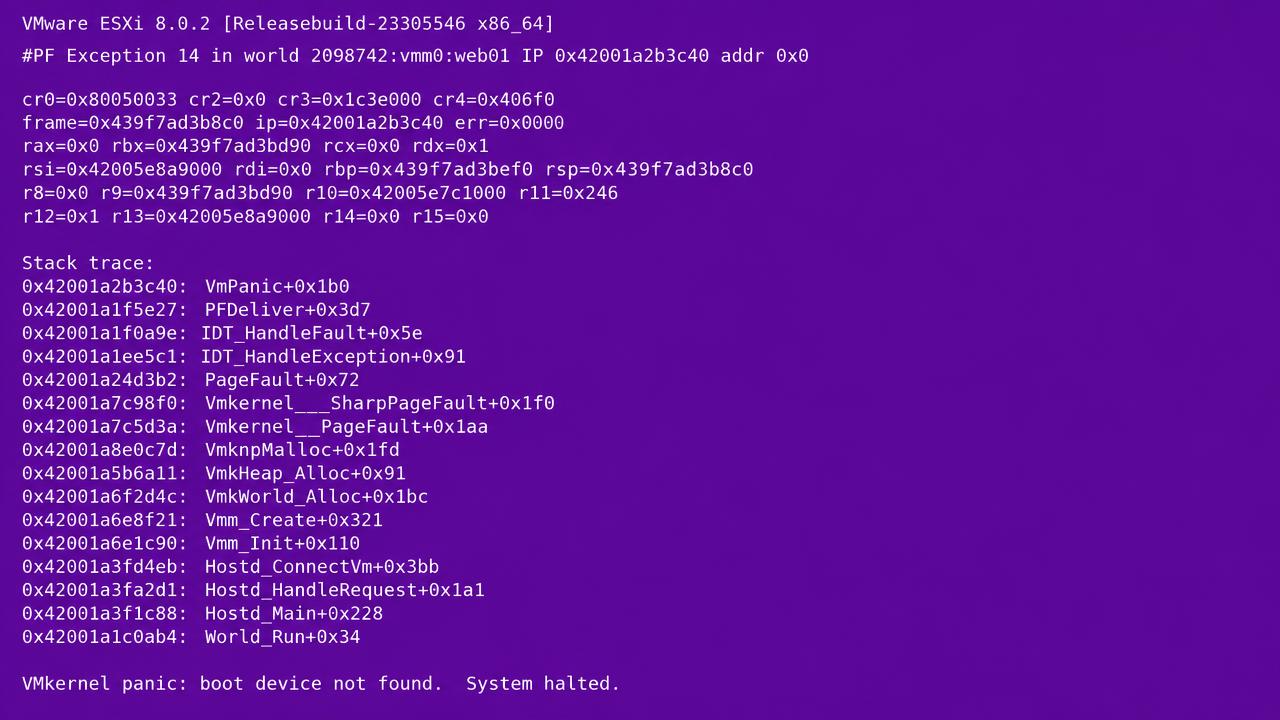
Take a photo or a console screenshot before anything else. The banner is not written anywhere else in a readable form, and an impatient reboot destroys your best evidence. Four lines carry most of the diagnostic value:
- Build line –
VMware ESXi 8.0.2 [Releasebuild-23305546 x86_64]. You need the exact build to match against known issues and driver compatibility. - Exception line –
#PF Exception 14 in world 2098742:vmm0:web01 IP 0x42001a2b3c40 addr 0x0. Exception 14 is a page fault;addr 0x0means a NULL dereference. The world name tells you which context was executing – avmm0world is the monitor for a specific VM,hostdis the management agent,helperworlds are kernel tasks. - Stack trace – read it bottom-up for causality and top-down for the failing frame. Frames named after a module (
nmlx5_core,lsi_mr3,nfnic,vmw_ahci) point straight at the driver to investigate. - Final panic string – e.g.
PCPU 12 locked up. Failed to ack TLB invalidateorSpin count exceeded (refCount). These strings are the highest-value search term you have.
Common panic strings and what they usually mean
| Panic string | Typical cause | First action |
|---|---|---|
| #PF Exception 14 … addr 0x0 | NULL dereference in a driver or kernel module | Identify the module in the top frames; check HCL and driver version |
| #MCE Exception 18 | CPU/memory hardware fault | Read the IPMI/iDRAC/iLO system event log; replace flagged DIMM or CPU |
| NMI: Uncorrectable error / IOH | PCIe or memory controller error signalled by BMC | Firmware and BIOS update; check PCIe riser and card seating |
| PCPU N locked up. Failed to ack TLB invalidate | A CPU stalled – often a driver spinning with interrupts disabled, or a power-management/microcode bug | Update BIOS/microcode, disable aggressive C-states, patch the implicated driver |
| Spin count exceeded – possible deadlock | Lock contention bug in a kernel module | Match the lock owner in the dump to a module; apply vendor fix |
| LINT1/IOCHK motherboard error | Hardware NMI from the platform | Hardware vendor case with the system event log |
Step 1: preserve the evidence
ESXi writes a compressed core dump to a diagnostic partition or a configured dump collector. Before you reboot, note whether the screen says the dump completed. After the host is back up, confirm your dump configuration:
esxcli system coredump partition get
esxcli system coredump file list
esxcli system coredump network get
If nothing is configured – which is common on hosts booting from small SD cards or USB devices – you have no dump to analyse. Fix that first, because the second PSOD is the one you want to solve properly:
# File-based dump on a VMFS datastore
esxcli system coredump file add --datastore=ds-local01 --size=2048
esxcli system coredump file set --smart --enable=true

# Or send dumps over the network to vCenter's dump collector
esxcli system coredump network set --interface-name=vmk0 \
  --server-ipv4=10.10.20.30 --server-port=6500
esxcli system coredump network set --enable=true
Step 2: extract and decode the dump
Convert the dump to a readable log with vmkdump_extract, then run a full support bundle so you also capture vmkernel.log, vmkwarning.log and hardware inventory:
ls -lh /var/core/
vmkdump_extract -l                 # list the zdump
vmkdump_extract vmkdump.1 -l       # extract vmkernel-log.1
vm-support -w /vmfs/volumes/ds-local01
The extracted log ends with the same backtrace shown on the purple screen, but with full symbol names and, crucially, the loaded module list. Cross-reference the module in the failing frame with its version:
esxcli software vib list | grep -i nmlx
esxcli system module get -m nmlx5_core
vmware -vl
Step 3: correlate with hardware and firmware
Half of all repeat PSODs in production clusters trace back to a driver/firmware mismatch after a patch cycle. Build a three-column picture for the failing host: ESXi build, async driver version, and adapter firmware. Then check each row against the VMware Compatibility Guide entry for the exact server model. A NIC driver that is one minor version ahead of its supported firmware is a classic source of intermittent page faults under load.
At the same time, pull the platform event log from the out-of-band controller. If the BMC recorded a correctable memory error storm on the same DIMM slot minutes before the panic, you have your answer and no software change is needed.

Step 4: reproduce or bound the fault
If the dump implicates a driver but the vendor has no matching known issue, you need to bound the problem. Practical techniques:
- Isolate the host. Put it in maintenance mode and keep it out of the DRS pool until it has run a full workload cycle without panicking.
- Change one variable. Roll the implicated driver back to the previously stable version with
esxcli software vib update -d /path/driver.zip, then observe for at least one full business week. - Stress the suspected path. If the trace points to storage, drive queue depth with a synthetic load; if it points at networking, run sustained multi-queue traffic across all uplinks.
- Watch the right logs. Tail
/var/log/vmkwarning.logfor the precursor warnings that almost always appear before a panic – SCSI aborts, link flaps, heap exhaustion messages such asHeap vmkapi already at its maximum size.
Step 5: prevent the next one
Once the root cause is fixed, harden the estate so the next incident is diagnosable and contained:
- Configure the network dump collector on every host, not just the one that failed.
- Standardise firmware and driver baselines with vSphere Lifecycle Manager images rather than per-host patching, so no host drifts out of a validated combination.
- Enable host isolation and admission control settings that let vSphere HA restart the affected VMs quickly; a PSOD on a properly configured cluster is an inconvenience, not an outage.
- Forward
vmkernelandvmkwarningto a syslog target so the precursor messages survive the reboot. - Alert on hardware health via the CIM/Redfish integration so correctable memory errors are seen before they become uncorrectable ones.
A worked example
A four-host cluster panicked twice in ten days, always on the same host, always with #PF Exception 14 and a top frame inside the RAID controller driver. The dump showed the driver version was two releases newer than the controller firmware after an out-of-band patch. Rolling the driver back stopped the panics immediately; the permanent fix was a firmware update that brought the pair back into a supported combination, applied to all four hosts via a lifecycle image so the cluster stayed uniform. Total diagnostic time once the dump was in hand: under an hour.
Quick reference checklist
- Photograph the purple screen – build, exception, world, stack, panic string.
- Confirm a core dump target exists; if not, configure one before the next event.
- Extract the dump and take a
vm-supportbundle from the same host. - Identify the failing module and compare driver, firmware and ESXi build against the compatibility guide.
- Read the BMC system event log for MCE, NMI or DIMM errors.
- Change one variable, observe a full workload cycle, then roll the fix estate-wide.
Treat every PSOD as a data-collection exercise first and a repair second. The hosts that panic repeatedly are almost always the ones that were rebooted before anyone read the screen.